An executive at Amazon.com stared at a computer screen. On the screen was a map of the world with an innumerable
number of dots. Each dot represented an
order by a customer of Amazon. Clicking
on a dot brought up a screen that showed the order, the shipping information,
how much it cost Amazon to acquire and deliver the order, and how much Amazon’s
profit would be when the order was complete.
By clicking on a country, the executive could see the orders in that
particular country. This allowed her to
see what was “hot” in that country and what merchandise needed more promotion there.
I’ve never been to an Amazon facility, nor do I know any
high-level executives at the company.
So, everything in the previous paragraph is completely
hypothetical. But, one can imagine that
something that what I described probably exists. It is mind boggling to think of the logistics
that goes into all of the orders that Amazon fills daily, even hourly!
This example is just one of economic geography. Economic geography is where geography (the
study of the earth) and economics (the study of the production, distribution,
and use of goods and services) collide.
To really simplify it, economic geography puts economics on a map.
.PNG)
The map above (from Wikipedia) shows the Gross Domestic
Product (the value of goods and services produced) per person in each
state. GDP is an economic statistic, and
when we put to a map by state, we are combining economics and geography. Of course it does not have to be on a
map. It could also be a table of GDP by
state and population and tell us the same thing, and it would still be economic
geography, even without the map.
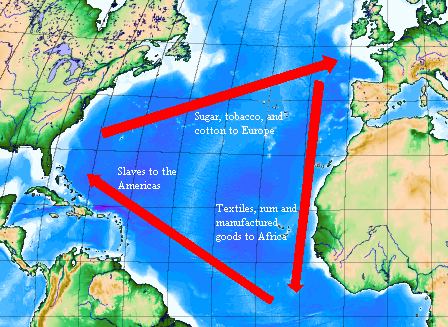
Another example of economic geography is the infamous
Atlantic triangle slave trade (illustrated above – from Wikipedia). This was when slaves were being captured in
Africa and being sold in the United States.
In the U.S. the labor of these slaves was used to produce cotton, sugar,
tobacco and other products that were sent back to Europe and Asia to be sold
for profit.